Mission #1: Exploring the MTBoS

Logarithms grow painfully slow. Students hear me say that but they don’t get it. I want them to really understand this type of function. I want them to grasp how slowly these graphs march off through the Cartesian plane in their deliberate quest to be part of the infinite. If a student cries out, “logarithms grow as slowly as their inverse exponential counterparts grow quickly” I’ve won. Okay, that never happens. But when I say that and they nod their heads instead of squint their eyes, it’s a start.

Consider graphing y=log(x) on a typical whiteboard coordinate grid where every square is 1in. x 1in.  and this whiteboard grid is at the front of the class for all to behold its power. There’s no pinching or dragging this graph. The axes are fixed.

Now imagine that this rich Desmos graph of the common log below were on this aforementioned static whiteboard.

Question 1: How many inches would we have to travel from the origin to reach a height of six inches? Six inches, that’s all. Start from the graph on the board in my room and follow the curve until it has climbed to a height of six inches.

Question 2: Where in San Diego county would we be? The answer would astound most any student. Would we find ourselves in neighboring Mr. W’s room? Tijuana?  La Jolla Shores? The Laguna mountains? That’s the two-fold question. Go in any direction. Ignore the curvature of the Earth to play this game. Flat map.

logmap

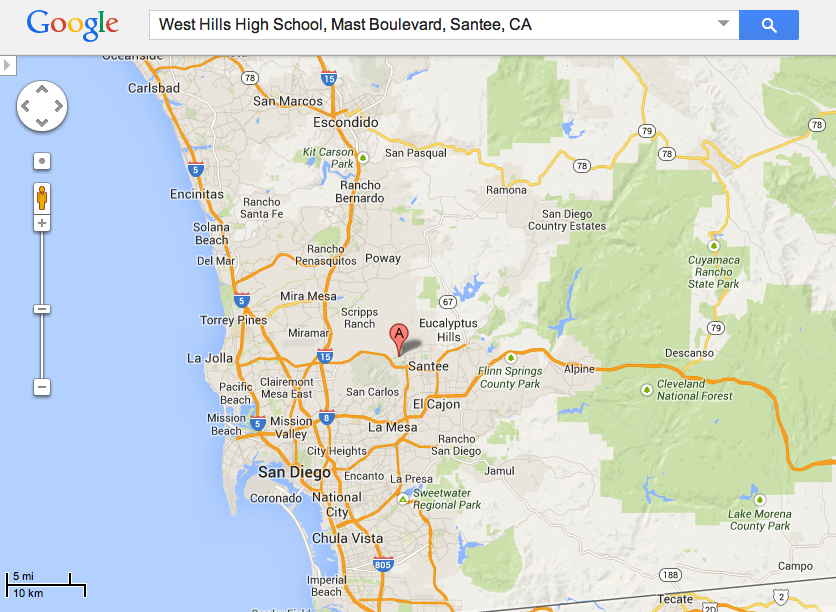
The answer is 1,000, 000 inches, since 10^6 is 1,000,000 and so log(1,000,000) = 6.  After some conversion, students will come up with 15.78 miles. But how to interpret that on a map?  15.78 miles in any direction. Enter, Mr. Circle and the need for a compass. Students have to make sense of the map they’re given, its scale, and how to measure off 15.78 miles.

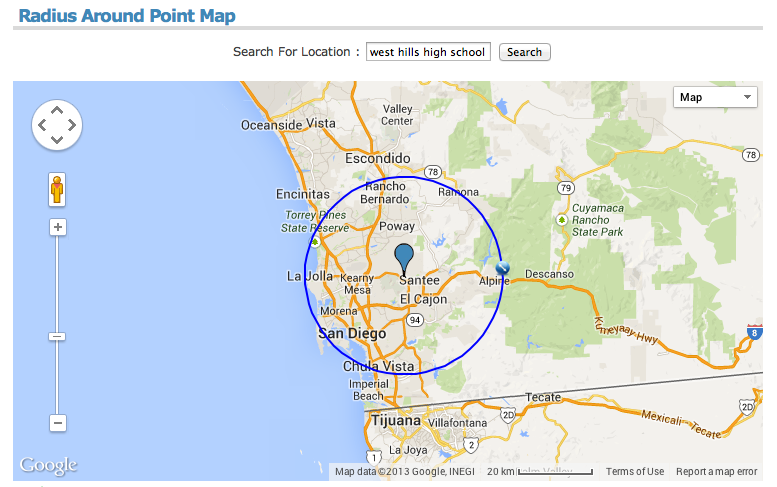
When I ask the question now I give them a paper Google map, and tell them to go at it. It’s a 15 minute or so activity that connects logarithms, geography, geometry, measurement, and their imagination.  In the near future when the access to tech is no biggie, they’ll pull up their own map and use tools like this website http://www.freemaptools.com/radius-around-point.htm and we can compare reaching heights of seven inches, one foot, etc. The shifting of the map wouldn’t be a problem on a device. Technology here would reduce the thinking involved to construct a circle of a given radius, but it’d allow deeper conceptual questions.

radiusmapI think when I get to logarithms this year and after students have played with the flat map, we can talk about the Earth’s curvature and what that really means. If the Earth curves roughly 8 inches per mile, how would the results change? Now we’re getting to “how” questions which are supremely better than “what” and “where” questions.

I also want the play with the metaphor of a ride and the value of thrill. Here’s what I’m thinking. A huge ride is built whose track is shaped like the common log function (or any log function for that matter.) The further you go on the ride, the more the ticket to ride costs. But the further you go, the greater the thrill at the end. For at the end, you stop, pivot, and come screaming straight down. Where is the most thrill for your money? Justify it. And I’ll need a cool name for the ride. Suggestions taken.

Marshmallow Minute

Billy started with 14 marshmallows in his mouth before the minute began and then ate 8 marshmallows every 10 seconds. Claudia started without any marshmallows in her mouth and ate 3 more every 4 seconds. Who will eat the most in the group over the course of ONE minute? What if we uncapped the minute and went forever?

I made an activity called the MarshmallowMinute that had students working in groups to eat a given number of marshmallows every so many seconds for ONE minute. I wanted them to absorb the concept of rate of change, with more than their eyes.

The MarshmallowMinute was initially designed for students in my Intermediate Algebra class, which is a lighter form of Algebra 2. Really, this activity is a first year algebra activity that can extend deeper depending on the course.

This activity provided context, fun, eating, yelling, and a jumping off place to go from graphing linear models to linear systems. It also gave another opportunity to discuss domain and range, as well as discrete (LiteBrite) vs. continuous (Etch-a-Sketch) graphs. 

Beware: one student did not understand he was supposed to EAT the marshmallows. At the end of his minute, he found a home for them in the trashcan. Poor kid.

Frustration alert! Finding fresh marshmallows that don’t stick together is more difficult than one might think. I’d actually consider making it the “Skittles Sixty Seconds” or “Popcorn Pandemonium” on my next go around.

1792 Penny

Image

1792 U.S. Copper Penny

Recently a rare copper penny from 1792 was auctioned off in Florida for  $1,150,000. In addition to lamenting the fact that my ancestors didn’t squirrel one of these away for me, my next thought was GEOMETRIC SEQUENCES! Isn’t 2012 simply another year on this penny’s valuable march of perpetuity? The penny fetched such a steep winning bid because it is both rare and in uncirculated condition.

I brought it up to my class and jump-started the wonderment: “How much did it go up in value each year?”

I was blown away by the thoughtful remarks:

1) “Well, it probably didn’t go up by the same amount each year.”

2) “It depends on if it went up by the same amount or the same percent.”

3) “It probably didn’t increase beyond its face value for years. In 1793 the penny was probably still worth a penny. And in 1801 it was probably still worth a penny.”

4) “Why would someone spend so much?”

5) “It probably depends on how many were minted.”

6) “What makes things valuable?”

I got more questions than we could answer. I especially liked the last question.  I kept our focus trained on “If the penny was worth $.01 in 1792, and in 2012 it was worth $1,150,000, what percent did it increase per year?” full-well knowing that we were assuming constant growth, which would not be the case. Fresh out of a unit on sequences and series, we explored.

I had no idea what kind of answer we’d get, and I let them know this. Let’s put our math to work.

Solving for the common ratio, it turns out the pretty penny increased in value by about 8.8% every year. It’s as though the penny were tied to the stock market’s historical average rate of return, before there was a stock market! We verified our algebra, recursively charting the penny’s 220 year existence.  I stored the exact value in the calculator, cleared my screen, initialized the sequence to 0.01, multiplied the answer by the stored ratio, which I named R.  Every time I pressed ENTER the value of the penny revealed itself with each passing year.

After a minute or two of thrilling tedium, the value of the coin reached exactly $1,115,000. Priceless.

Extensions? If the coin continues at this rate of appreciation, when will it hit $2 million?

To Kill A Mockingbird, Apple, and a US Postage Stamp

Given a known starting value and a current value, what other interesting objects can we examine to determine their average rate of growth? I threw together a Growth Rate Comparison Worksheet to compare Apple’s stock value from its IPO to roughly today, a first edition of To Kill a Mockingbird, and the Inverted Jenny U.S. Postage Stamp. The worksheet is bare bones but should provide a place for everyone to give their “two cents!”

Etch-A-Sketch and Lite Brite

The classic red-and-white Etch A Sketch model
Image via Wikipedia

This has worked wonders in my algebra 2 classes when we’re discussing ways to write domain and range. Talking about a continuous graph, I’ll describe it as an Etch-A-Sketch graph. When I reference a discrete graph, or as they know it – a collection of ordered pairs-I call it a Lite Brite graph. Kids get it.

When we’re looking at an Etch-A-Sketch graph, we know to usually describe the domain with inequality symbols, whereas with a Lite Brite graph every element (or brite peg) must be listed.

This is even useful for discussing whether or not the graphs (relations) are functions or not. Most cool pictures on either display will obviously not be functions however.  This year I asked for a student volunteer to draw a function on the Etch-A-Sketch while it sits under the document camera. It’s hilarious because if the student turns only the right knob, game over. That’s the vertical knob. It takes a mixture of x and y components, or turning both knobs, to avoid the buzzer that accompanies an undefined slope.

Lite Brite Snail

Image by J.G. Park via Flickr

Keeping a Lite Brite and an Etch-A-Sketch in my classroom makes my teaching better and usually brings back positive childhood memories for me and my students. It’s a win-win.

You Can Count on this Game

This week I made a few changes to a class game I’ve done in the past. It went over like gangbusters and brought home the concept of relations and functions. Toward the end of my lesson on functions as special relations, I asked my algebra 2 classes if they wanted to play a game. Captive audiences do.

Here’s how it works. Tell the class you want them to count to ten as a class by taking turns shouting out the next number.  Getting to ten on the first try is near impossible. It takes several rounds for them to catch on. These are the rules:

No conspiring.  Otherwise leaders will emerge to organize a winning strategy.

All students must take a turn before anyone can go twice.

You shout “Go.” One student shouts “one,” another “two” and so on. If two (or more) shout out a number at the same time, the counting starts over because there’s overlap. Thus, the counting turns the function into a relation.

Several students mentioned they did something like this in their drama class except they were blindfolded. This twist could make it more interesting. I’m not sure. I like to see the anticipation on their faces.

The game works on many levels. It’s fun. It gives a non-math platform to talk about math (bazinga!), it hones the “failure leads to success” behavior I’m constantly talking about for math success, and it allows me to learn more about the character of the class.

Here’s an example of a round in which the class counted successfully to the number four, but then two students shouted out “five” and derailed the game.