
Logarithms grow painfully slow. Students hear me say that but they don’t get it. I want them to really understand this type of function. I want them to grasp how slowly these graphs march off through the Cartesian plane in their deliberate quest to be part of the infinite. If a student cries out, “logarithms grow as slowly as their inverse exponential counterparts grow quickly” I’ve won. Okay, that never happens. But when I say that and they nod their heads instead of squint their eyes, it’s a start.
Consider graphing 
Now imagine that this rich Desmos graph of the common log below were on this aforementioned static whiteboard.

Question 1: How many inches would we have to travel from the origin to reach a height of six inches? Six inches, that’s all. Start from the graph on the board in my room and follow the curve until it has climbed to a height of six inches.
Question 2: Where in San Diego county would we be? The answer would astound most any student. Would we find ourselves in neighboring Mr. W’s room? Tijuana? La Jolla Shores? The Laguna mountains? That’s the two-fold question. Go in any direction. Ignore the curvature of the Earth to play this game. Flat map.
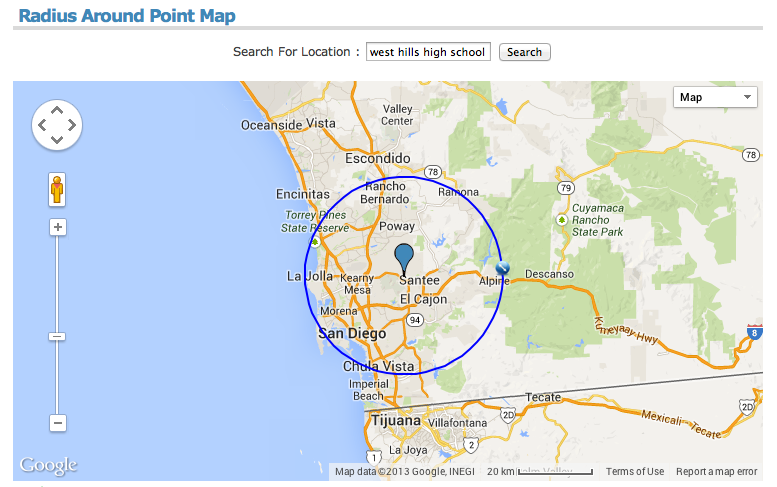
The answer is 1,000, 000 inches, since 10^6 is 1,000,000 and so log(1,000,000) = 6. After some conversion, students will come up with 15.78 miles. But how to interpret that on a map? 15.78 miles in any direction. Enter, Mr. Circle and the need for a compass. Students have to make sense of the map they’re given, its scale, and how to measure off 15.78 miles.
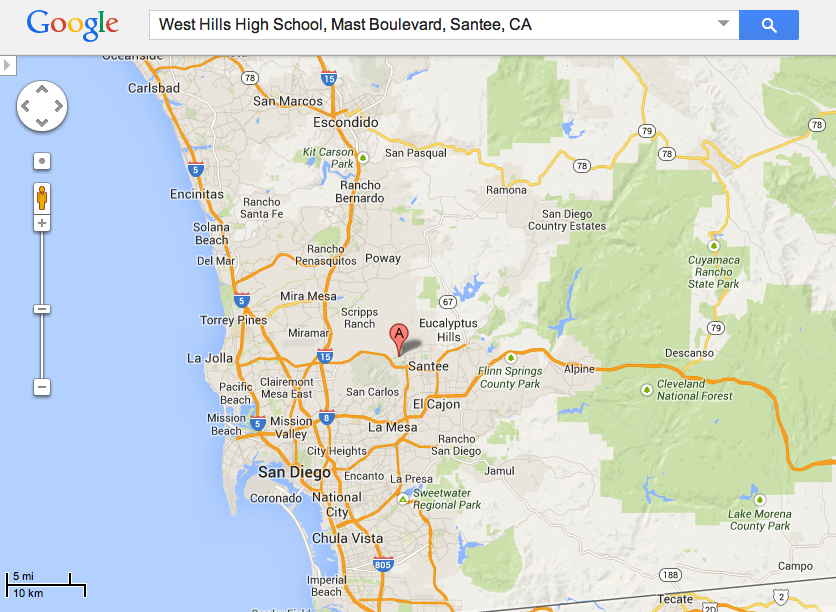
When I ask the question now I give them a paper Google map, and tell them to go at it. It’s a 15 minute or so activity that connects logarithms, geography, geometry, measurement, and their imagination. In the near future when the access to tech is no biggie, they’ll pull up their own map and use tools like this website http://www.freemaptools.com/radius-around-point.htm and we can compare reaching heights of seven inches, one foot, etc. The shifting of the map wouldn’t be a problem on a device. Technology here would reduce the thinking involved to construct a circle of a given radius, but it’d allow deeper conceptual questions.
 I think when I get to logarithms this year and after students have played with the flat map, we can talk about the Earth’s curvature and what that really means. If the Earth curves roughly 8 inches per mile, how would the results change? Now we’re getting to “how” questions which are supremely better than “what” and “where” questions.
I also want the play with the metaphor of a ride and the value of thrill. Here’s what I’m thinking. A huge ride is built whose track is shaped like the common log function (or any log function for that matter.) The further you go on the ride, the more the ticket to ride costs. But the further you go, the greater the thrill at the end. For at the end, you stop, pivot, and come screaming straight down. Where is the most thrill for your money? Justify it. And I’ll need a cool name for the ride. Suggestions taken.

I have always not like logs. Always. However, I must say, after reading your post, I must say that they actually make sense and I can see the purpose for them-they actually are rather fascinating. Wish that my hs junior had the opportunity last year to explore logs in Algebra 2 with a rich task like this. His pre-calc teacher has done a great job and he likes logs. Will be passing along the link to your task.
Cool! I like the task progression, and the ride development sounds like a great concept project that students could collaborate on- I will look forward to hearing more! (I suppose the name Log Flume won’t do, hmmm?)
“Log ride, log flume” got usurped by the cursed wooden log rides!
That sounds so cool! I love how rich and interactive that task is. Looking forward to seeing how that goes.
Great post! I love the hands on – when I got to the part about Tijuana and La Jolla Shores I wanted to grab a paper map and figure it out myself 🙂
Love the transition to a map instead of leaving it at “omg 1,000,000 inches is a lot!”
fantastic ideas! and this is one of those ones where you can see how technology would really improve the task. love that it is incorporating logarithms, locus, scale, etc.
but this also reminds me that gosh, inches & miles are a silly measurement system (i’m american but live and work abroad and have now completely forgotten — if i ever knew — how many feet are in a mile). there’s actually an entire mini units conversion lesson in here as well if you work with the metric system.
a simple extension is to have the students find their desired location, the distance to it, and therefore how high the function is, just to reinforce that you can look at this both ways.
Thanks for this activity. I just adapted this for my Algebra 2 class, with strong results. Students were highly curious and engaged – and it really drives home the terribly slow way that logs grow. We graphed exponentials next to logs next, and kids seemed to make solid connections between the inverse nature of this relationship. My class extended your original question to include: What if we circumnavigated the globe (along a great arc) and ended up where we started? How high would we be on our y-axis? (9.6 or 9.2 depending on which one of my students you trust – I haven’t yet verified). I like the idea of following a line of latitude for comparison as well.
Thanks!
Glad you liked the activity, and thanks for letting me know how you extended the questioning.
Pingback: Things I Thought I Knew – Insert Clever Math Pun Here